TOPPView
Introduction
TOPPView is a graphical application for inspecting and visualizing MS and HPLC-MS data. It can be used to inspect files in mzML, mzData, mzXML and several other text-based file formats.
In each view, several datasets can be displayed simultaneously using the layer concept. This allows visual comparison of several datasets as well as displaying input data and output data of an algorithm together.
TOPPView is intended for visual inspection of the data by experimentalists as well as for analysis software by developers.
User interface
The following image illustrates different components of TOPPView’s user interface.

Components include:
Display modes and options
A Viewer that displays visual data.
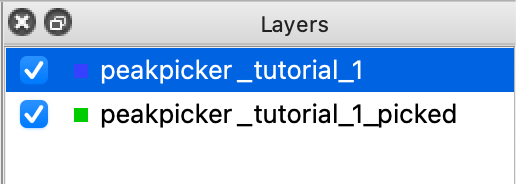
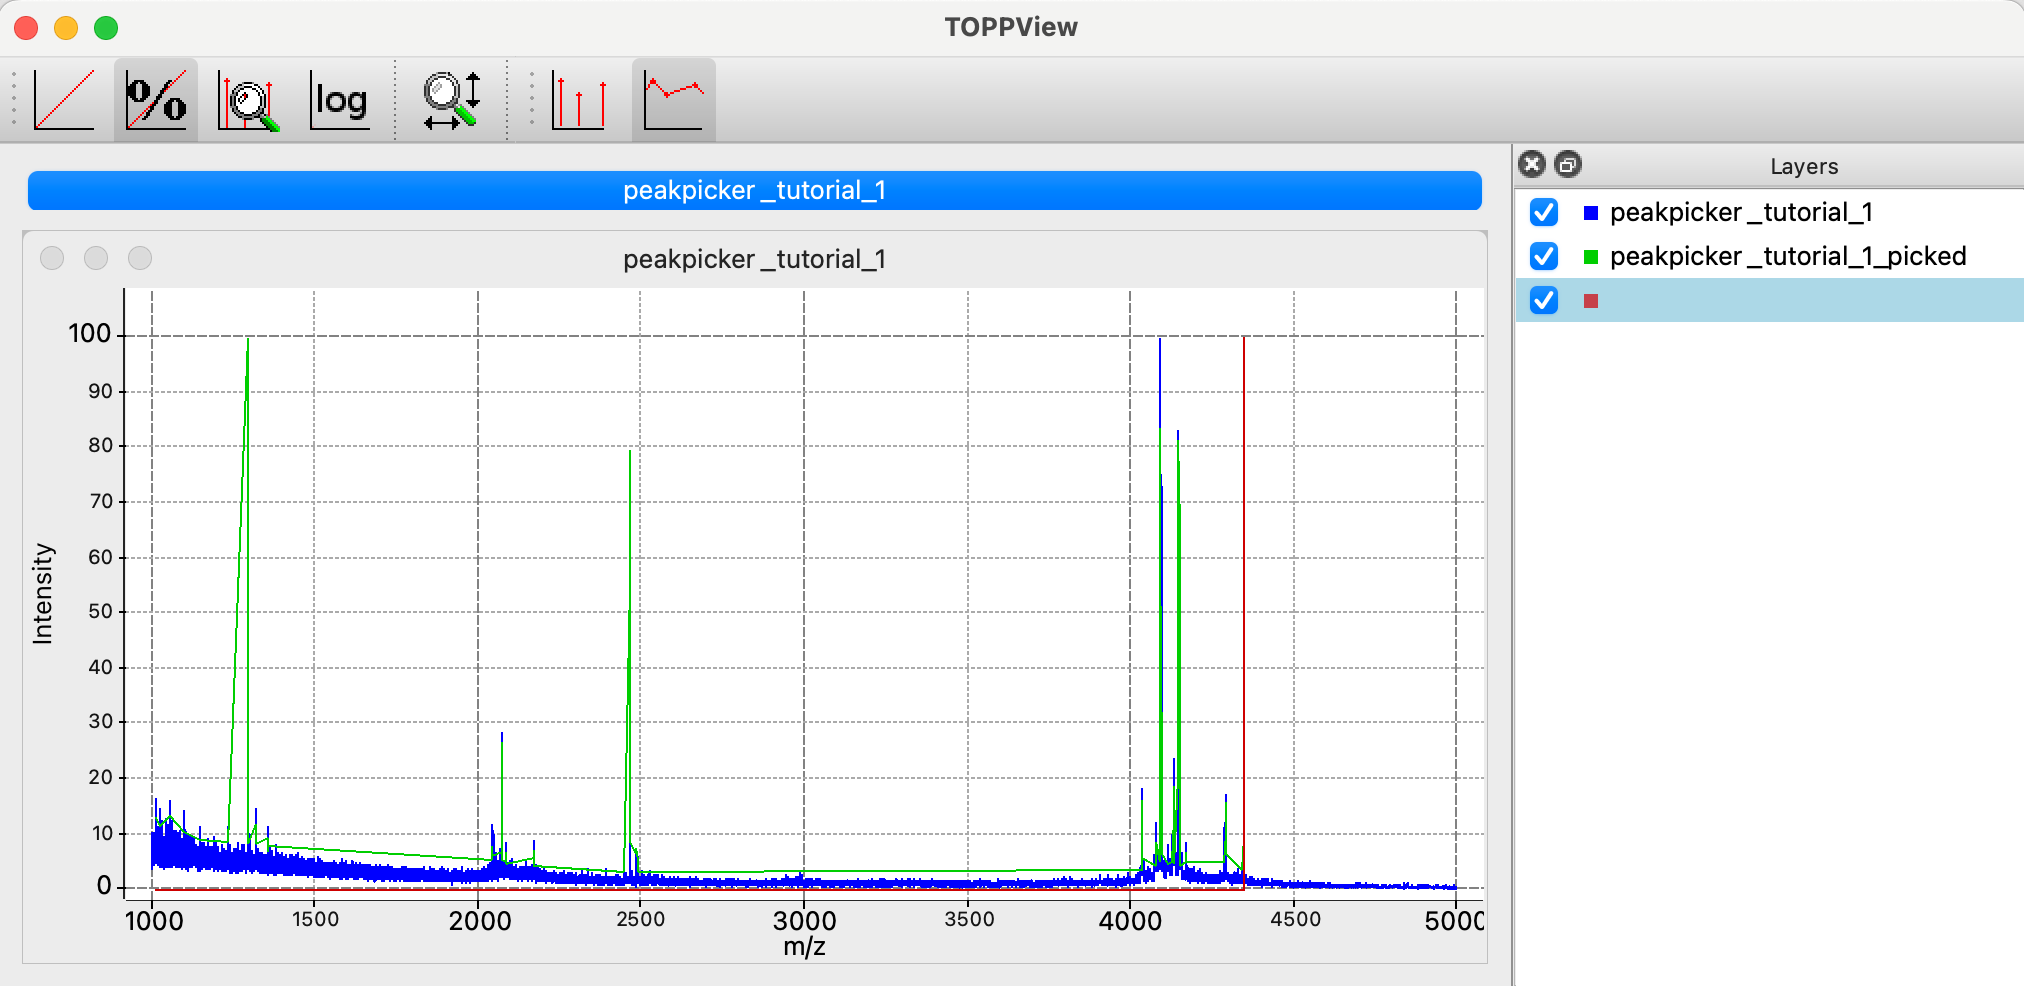
Layers
You can visualize several datasets by creating layers. In the Layers window (dock window in the upper right corner), layers can be hidden and shown using the check box in front of each layer name.
Data filtering window
Log window to view textual output of applying TOPP tools to data.
Views windows that show tabulated information about the dataset.
Import a file
To import data into TOPPView:
Go to File > Open file.
Choose a file from the file importer and click Open.
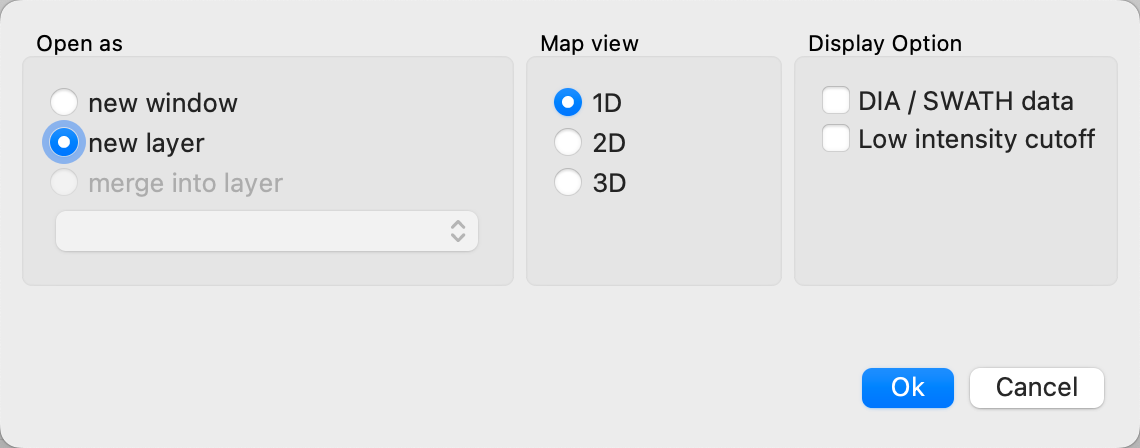
Select options from the following panel and click Ok:
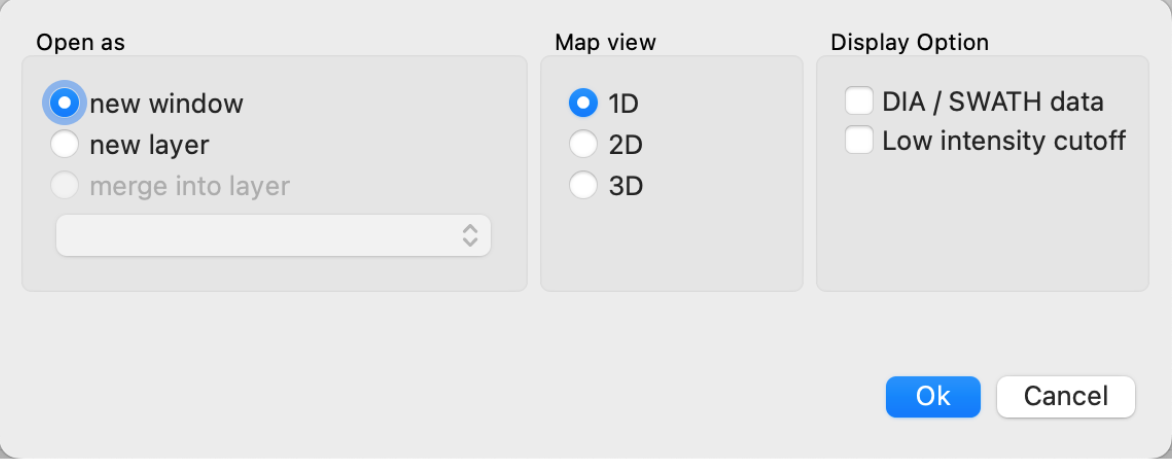
You can choose to open the new dataset as a new window or new layer. Choosing new window will open a new tab. If you are planning on comparing multiple datasets and want to view them all at once, choose new layer.
TOPPView automatically selects the Map view depending on the data you have imported.
You should be able to see your data in the Viewer.
Process data in TOPPView
The following section details how to apply TOPP tools and filter data in TOPPView.
Apply TOPP tool
OpenMS provides a number of TOPP tools that can be applied to your data.
To apply a TOPP tool to your dataset:
Select a layer in the Layers window. The selected layer will be highlighted blue.
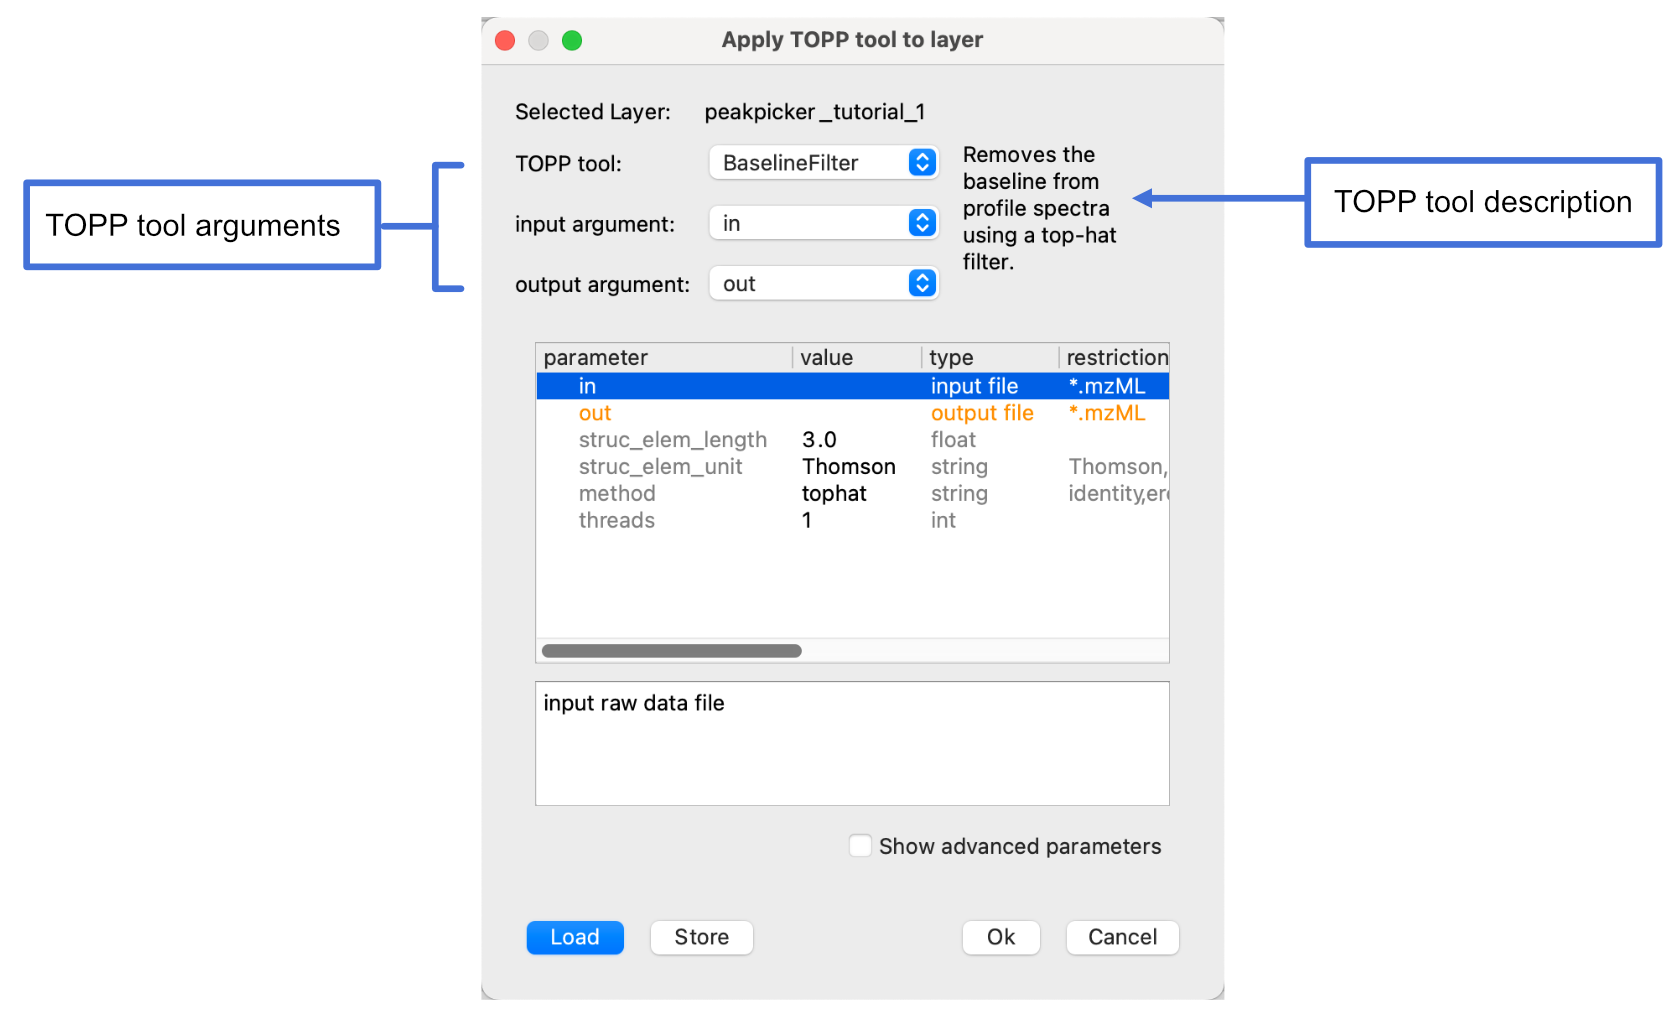
Go to Tools > Apply TOPP tool to whole layer. This will open a panel to select and configure your TOPP tool.
Select a TOPP tool from the dropdown menu. A description of the TOPP tool will be displayed on the right. You may have to also specify the input argument as well though TOPPView might automatically select this option for you. To save the output to a file, specify the output argument.
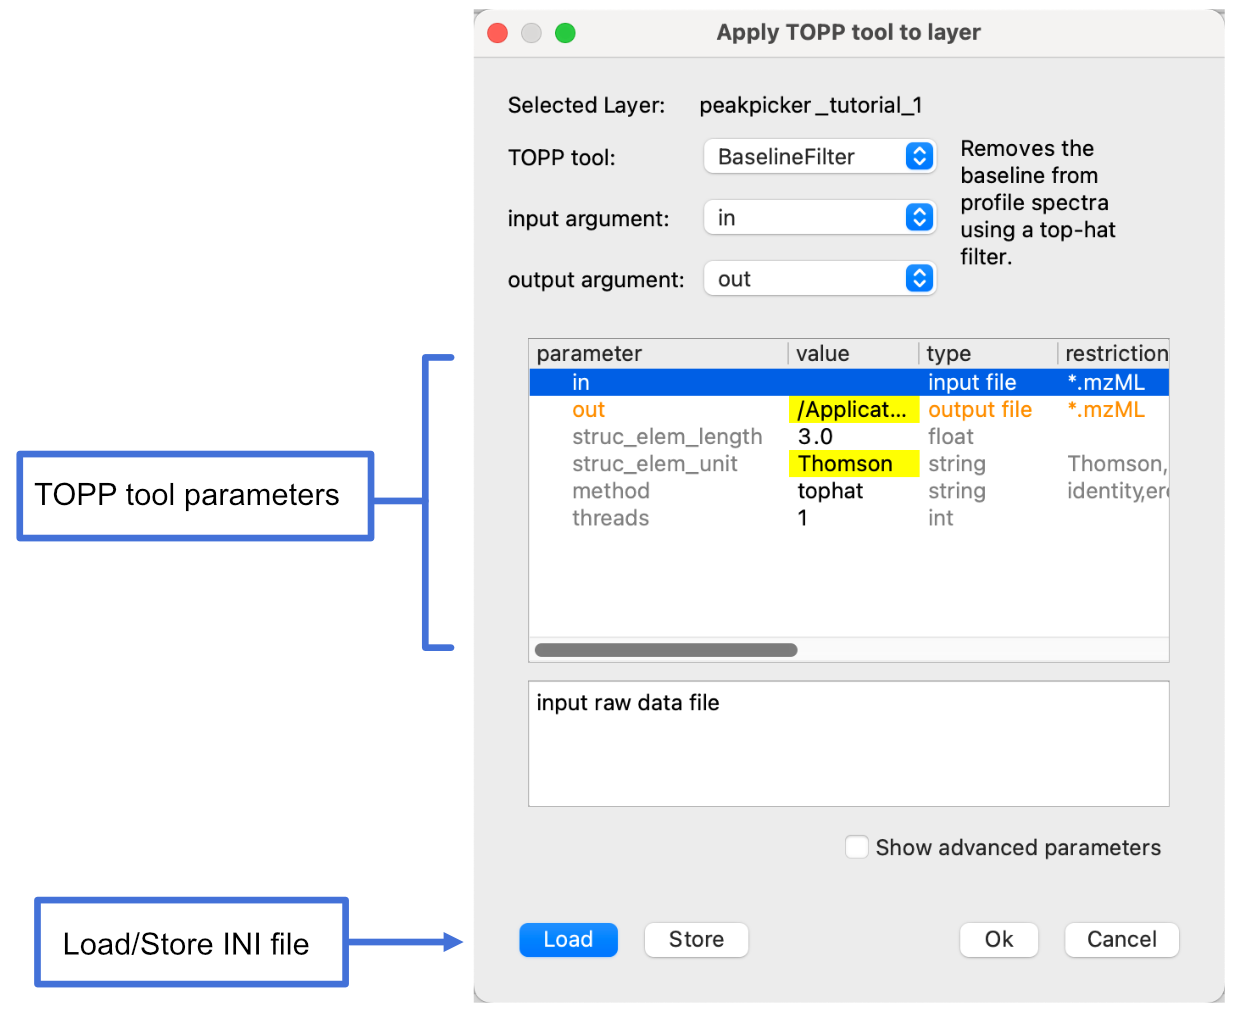
Specify the TOPP tool parameters by either:
- Loading an INI file by clicking Load and selecting an INI File from the file importer.
- Editing the parameters shown in the table and then saving the INI file. To edit a parameter, double click a row in the table and enter a value or choose from the options available. The modified value will be highlighted yellow. To save the parameters, click Store and enter a file name for the INI file.
Click Ok. You will be prompted to load the new dataset as a new window or a new layer. Choose an option and click Ok.
If you chose to load the data in a new window, a new tab will appear. To view that data, select the tab. If you chose to load the data as a new layer, the data will be visualized in the Viewer. You can also see the new layer wihout a name in the Layers window.
(Optional) If you did choose to import the data as a new layer, give the new layer a name. To do this, right-click the layer in the Layers window and select Rename. Enter a name and click OK.
Filter data
You may only want to see some data from your dataset and hide the rest. OpenMS allows you to filter data based on the following fields: Intensity, Quality, Charge, Size and Meta data.
To filter your data:
Select a layer from the Layers window.
Open the Data filters window by clicking the tab at the bottom of the screen.
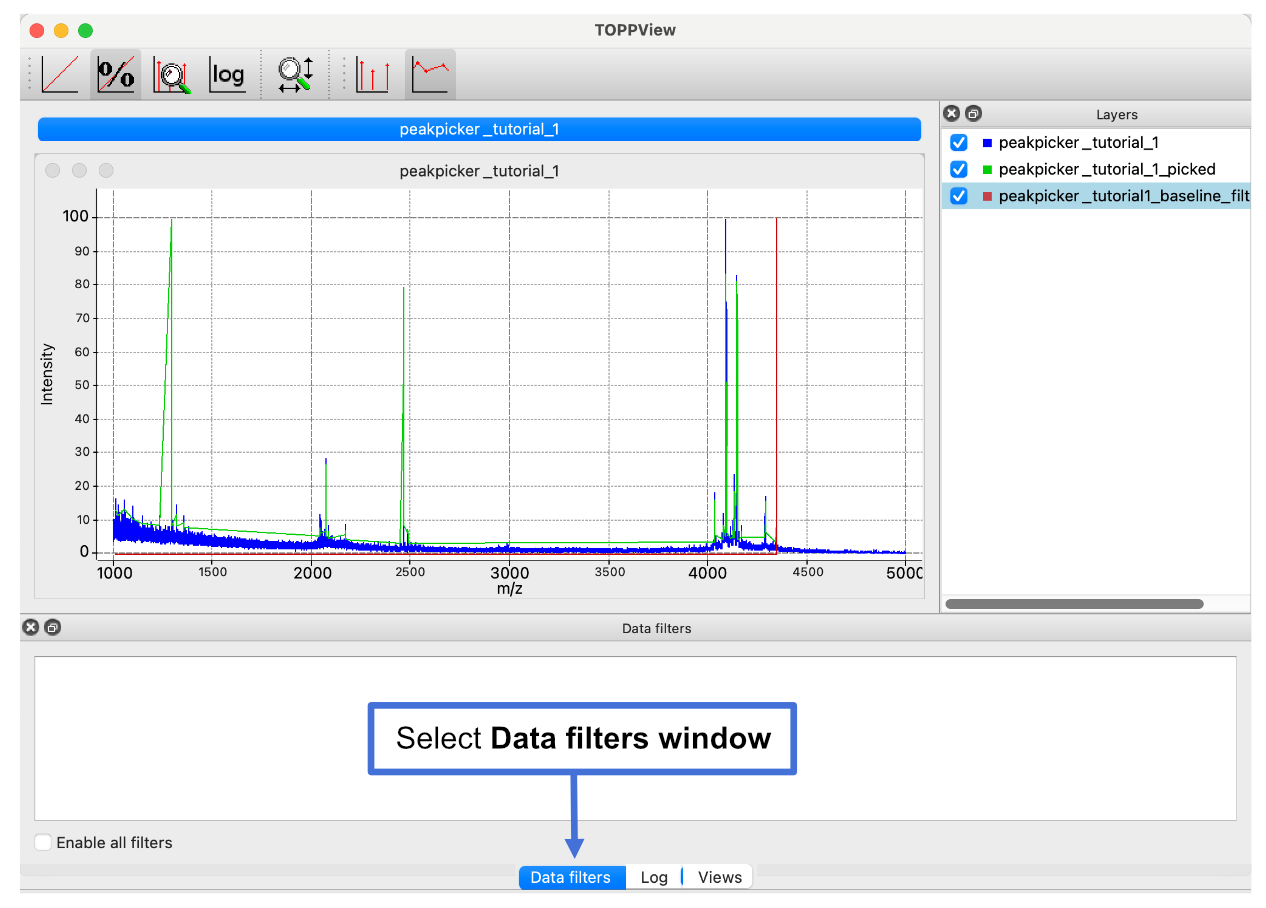
Add a filter to the Data filters window by right-clicking the window and then selecting Add filter from the context menu.
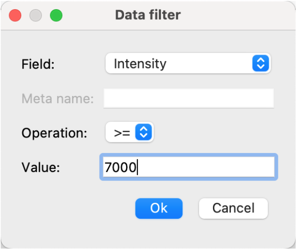
Select a field, select an operation and enter a value. For example, to exclude all peaks with an intensity of less than 6999, set field to Intensity, operation to => and set the value to 7000. Click Ok on the panel to apply the changes.
You should see only see data that satisfies the specified criteria.
Additional topics
You might want to check out the following topics: