Mass spectrometry (MS)
Mass spectrometry is an analytical technique used to determine the abundance of molecules in a sample.
Key components of MS
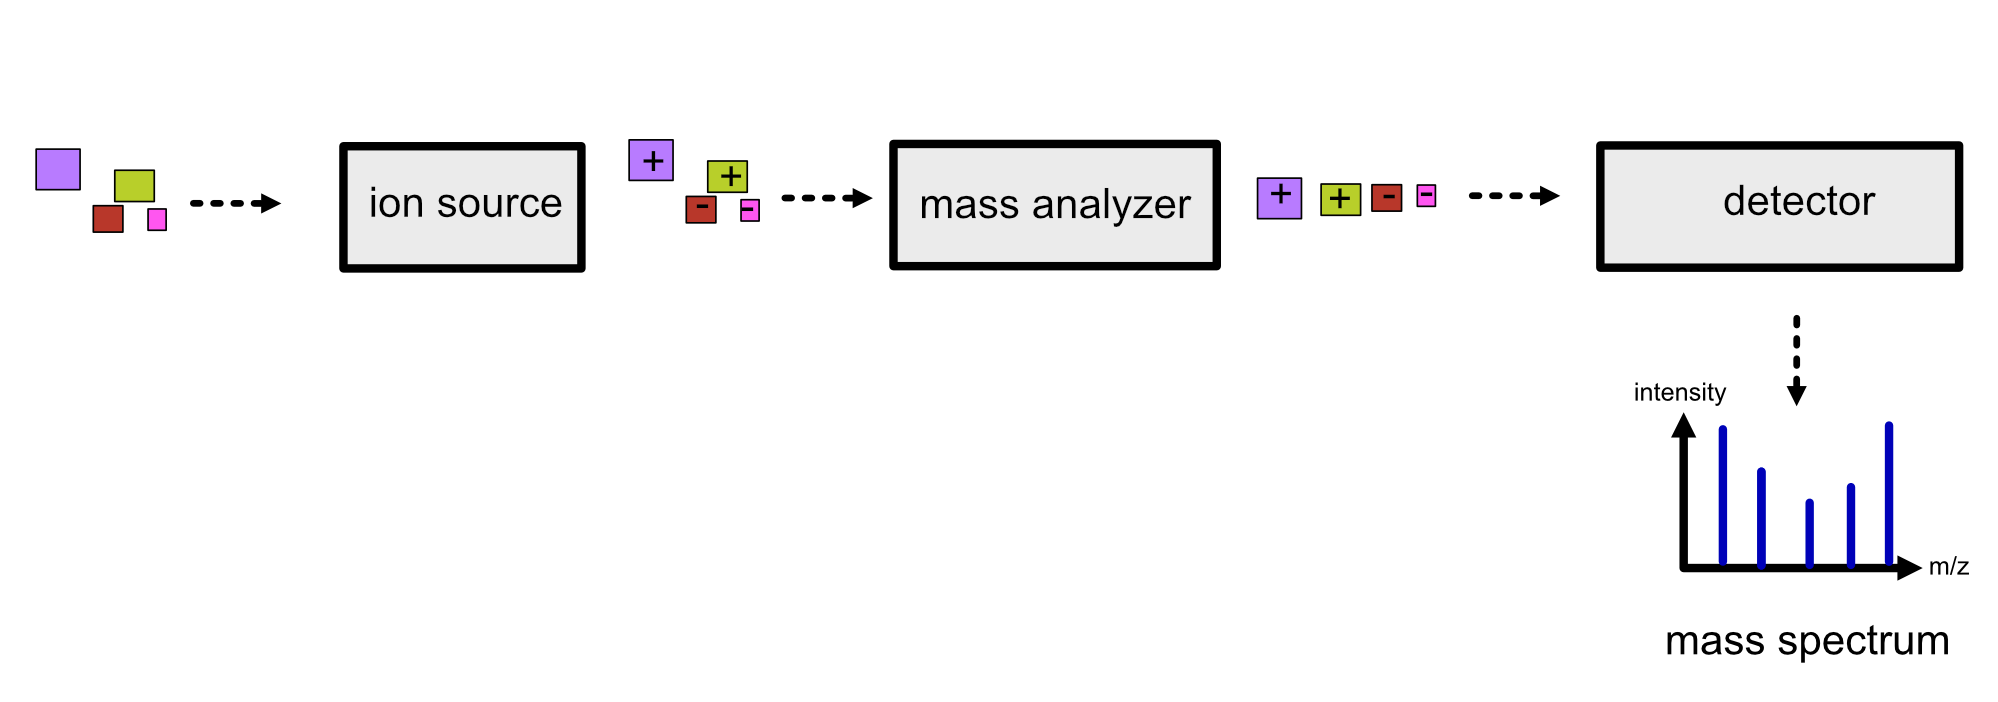
There are three key components in a mass spectrometer:
An ion source, which generates ions from the incoming sample. All mass spectrometry techniques rely on ionized molecules to control their movement in an electric field.
A mass analyzer, which separates the ions according to their mass-to-charge (m/z) ratio. There are several types such as time of flight (TOF), orbitrap and quadrupole mass analyzers. Depending on the mass analyzer, OpenMS offers calibration tools, so that highly accurate results can be achieved.
A detector, which scans ions at a given time point producing a mass spectrum, where the intensity is plotted against the m/z.
Refer to the image below for a diagrammatic representation of the key components in MS.
Ion source
We want the analytes to move through the electrostatic and electromagnetic fields in the mass analyzer. To achieve this objective, we need to convert them to ions by charging them. There are a number of ways to charge our analytes including:
Electrospray Ionization (ESI)
Matrix Assisted Laser Desorption/Ionization (MALDI)
Electron Impact Ionization (EI)
In proteomics and metabolomics, ESI and MALDI are used because they are soft ionization techniques. A soft ionization technique is one which charges analytes while keeping the molecules of interest largely intact, so that they can be characterized easily at a later stage. Hard ionization techniques such as EI shatter analytes in smaller fragments, making it difficult to characterize large molecules.
Given that OpenMS focuses on proteomic and metabolomic applications, we will describe ESI and MALDI in further detail.
Electrospray Ionization (ESI)
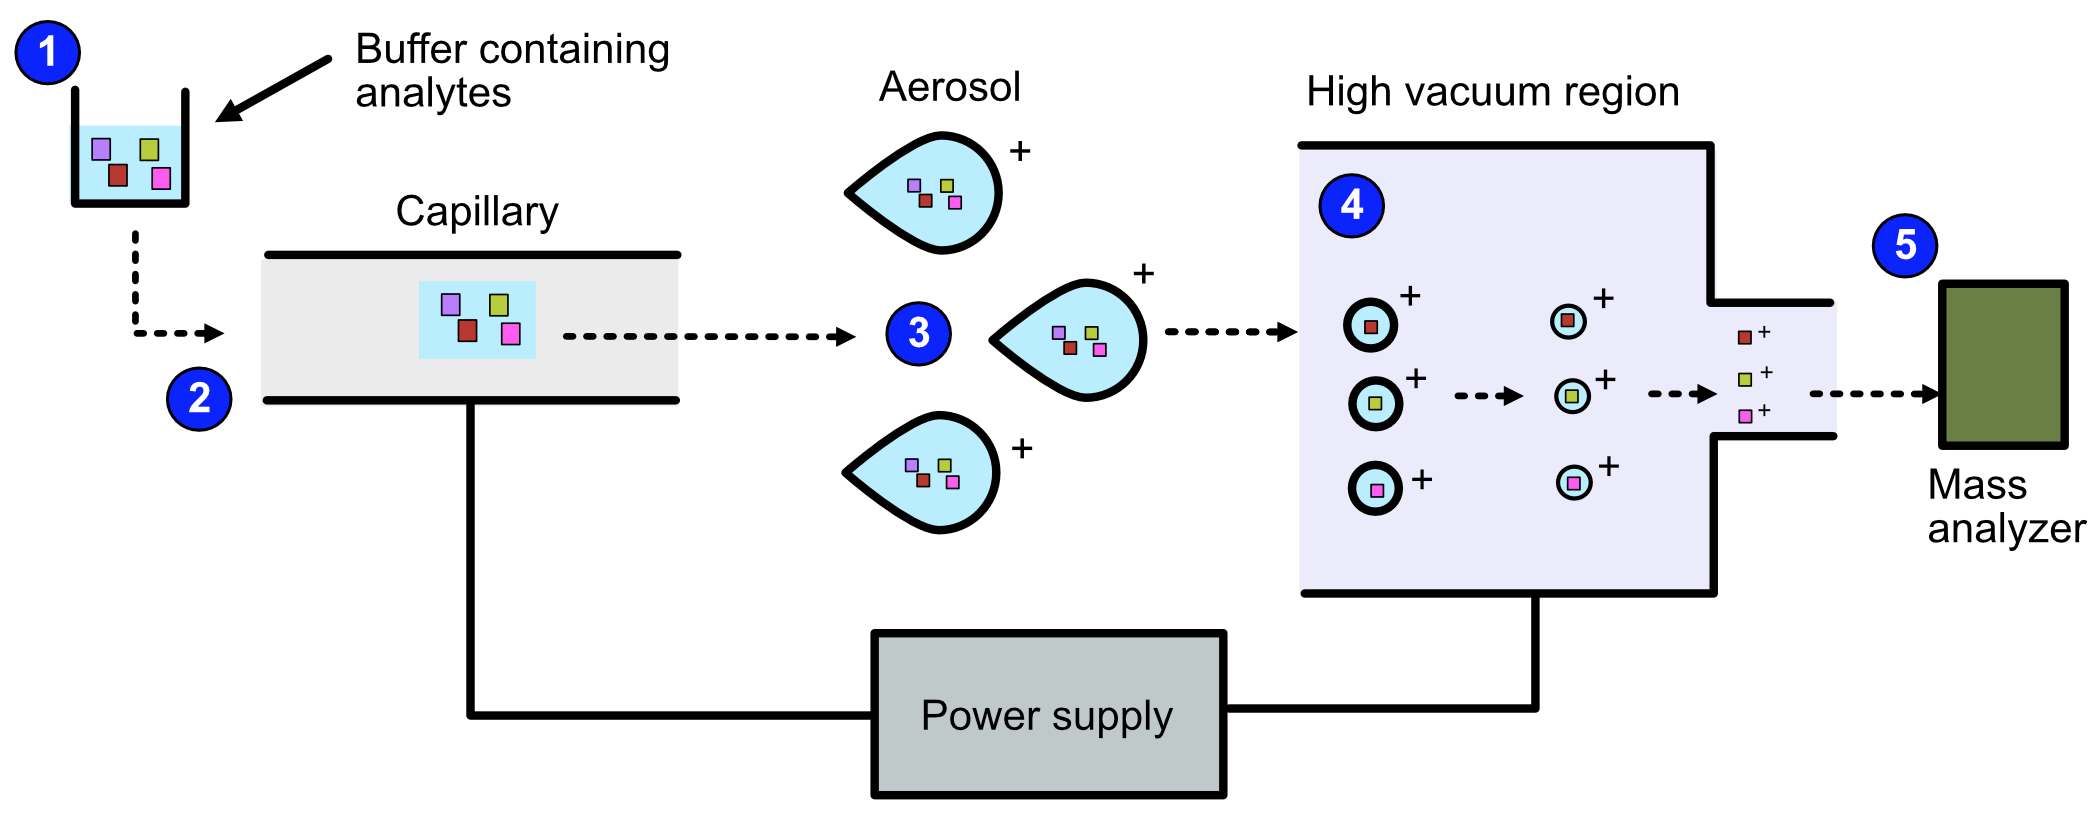
ESI can be broken down into the following steps.
The sample is dissolved in a polar, volatile buffer.
The sample - dissolved in the buffer - is pumped through a thin, stainless steel capillary.
The sample is converted to small, charged, stable droplets (aerosolized) by applying high voltage.
The aerosol is directed through regions of high vacuum until the droplets evaporate until only the charged molecules are left.
The particles are fed to the mass analyzer.
Refer to the image below for a diagrammatic representation of the steps in ESI.
Video
For more information on ESI, view this video.
Matrix Assisted Laser Desorption/Ionization (MALDI)
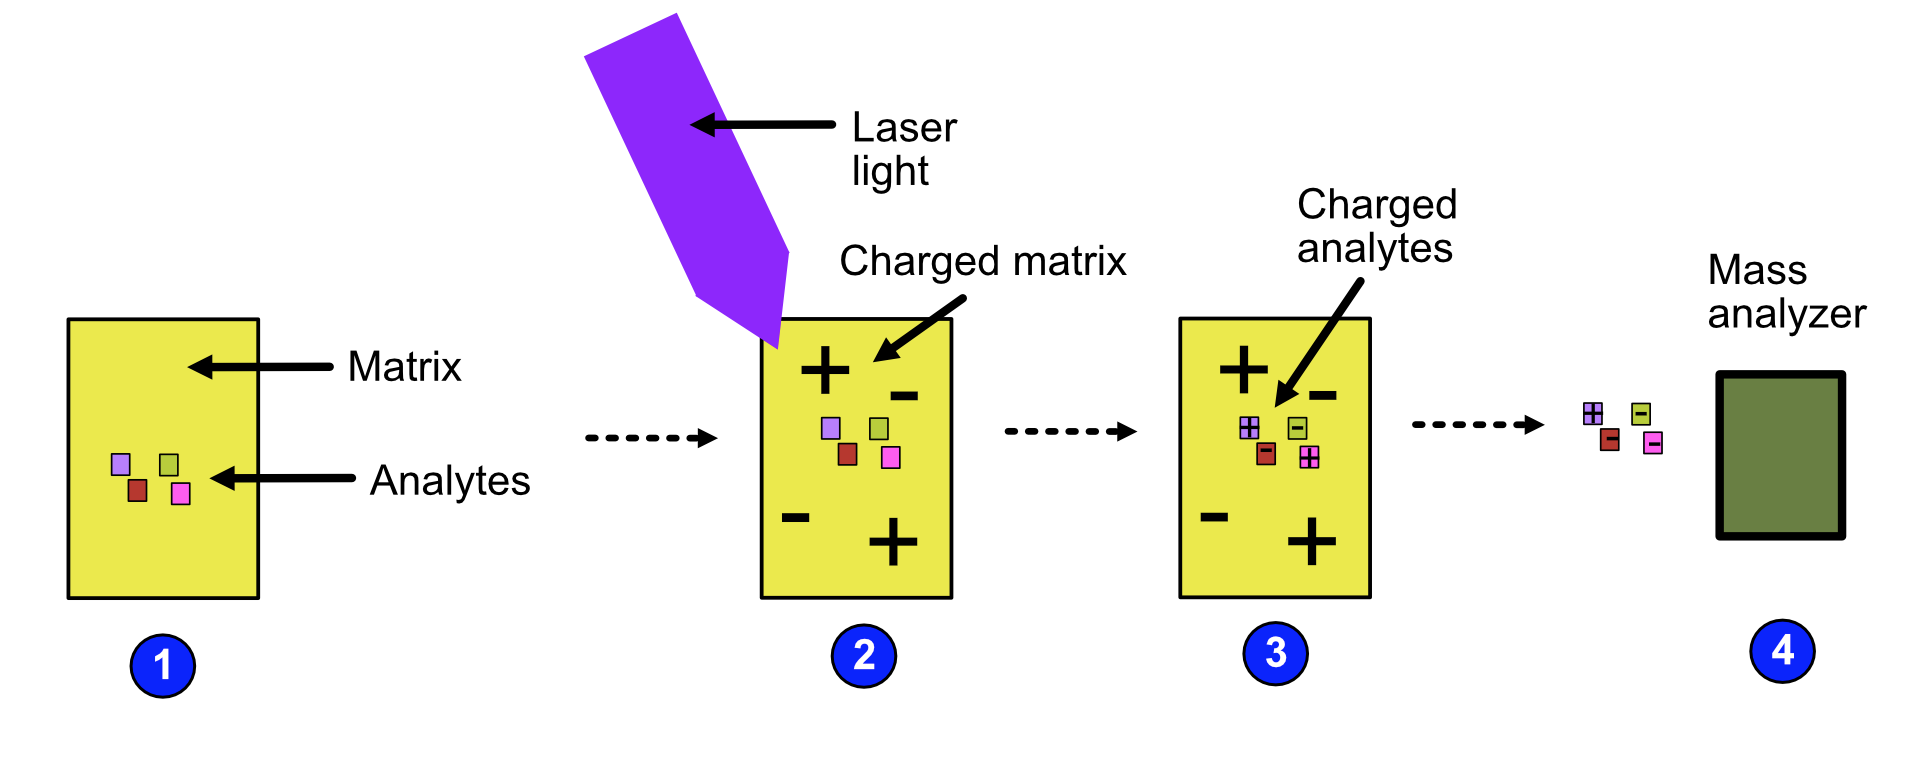
MALDI can be broken down into the following steps:
The analytes are mixed with a small organic molecule known as a matrix.
The mixture is exposed to radiation with short pulses of laser light, charging the matrix.
The matrix transfers its charge to the analytes because the wavelength of the laser light is the same as the absorbance maximum of the matrix.
The analytes become charged and are fed to the mass analyzer.
Refer to the image below for a diagrammatic representation of the steps in MALDI.
Video
For more information on MALDI, view this video.
Mass analyzer
Once the analytes have been charged by the ion source, we want to now sort the analytes by their mass-to-charge ratio for easy identification.
A number of mass analyzers exists. These include:
Quadrupole analyzer
Time-of-Flight analyzer
Orbitrap analyzer
The next sections describe each analyzer type in detail.
Quadrupole
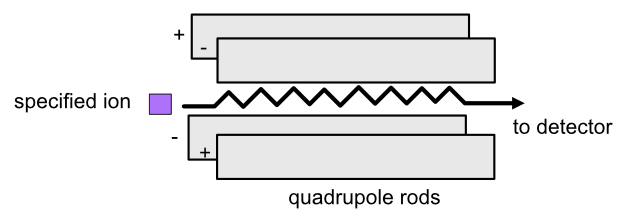
In a quadropole analyzer, you can set the quadropole voltage so that ions with a specific m/z ratio travel through. The oscillating electrostatic fields stabilize the flight path for the ions so that they can pass through the quadropole. Other ions will be accelerated out of the quadropole and will not make it to the end.
Refer to the image below for a diagrammatic representation of the quadrupole analyzer.
Video
For more information on quadrupole analyzers, view this video.
Time-of-Flight (TOF)
In a time-of-flight analyzer, ions are extracted from the ion source through an electrostatic field in pulses in a field-free drift zone. An electrostatic mirror called a reflectron reflects the ions back onto the next component of mass spectrometry, the detector. The detector counts the particles and records the time of flight from extraction to the moment the particle hits the detector.
Refer to the image below for a diagrammatic representation of the TOF analyzer.
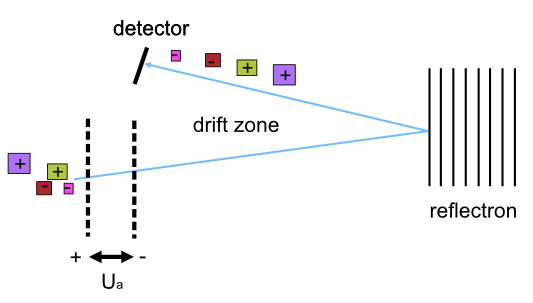
Lighter ions fly faster than heavier ions of the same charge and will arrive earlier at the detector. Therefore, an ion’s time of flight depends on the ion’s mass. The ion’s time of flight is also dependant on the ion’s charge. This can be demonstrated by using the following equations:
Potential energy is transferred to an ion with charge q accelerated by an electrostatic field with voltage.
The potential energy is converted to kinetic energy as the ion accelerates.
We know that for a given path,s, from extraction to the detector, the time of flight, t is equal to:
Therefore, t, for a given instrument’s path length, s, depends on an ion’s charge and mass.
Video
For more information on TOF analyzers, view this video.
Orbitrap
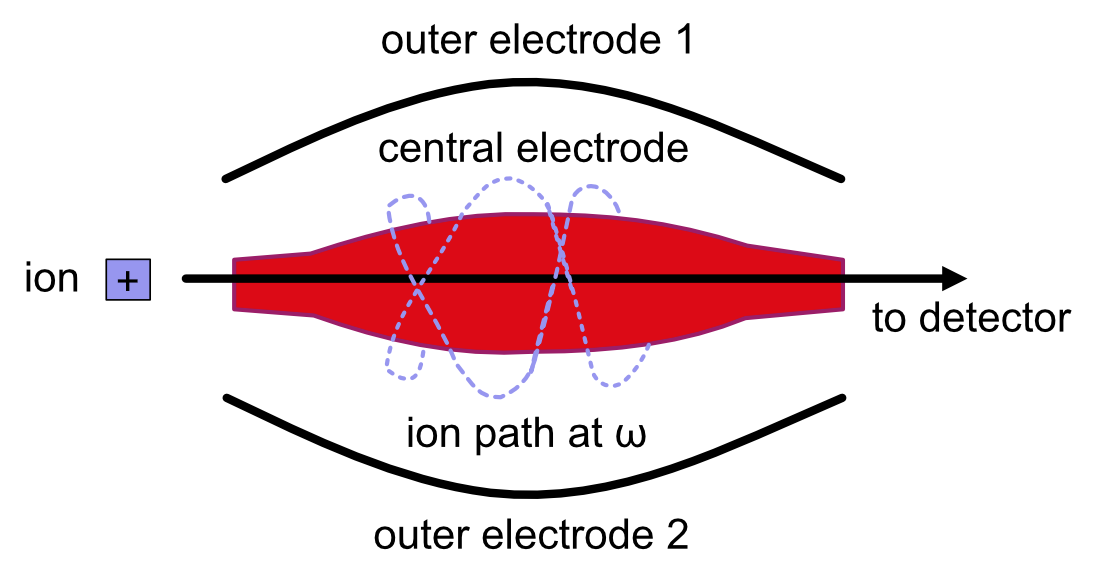
The orbitrap analyzer is the most frequently used analyzer in mass spectrometry for proteomic and metabolomic applications. It consists of two outer electrodes and a central electrode. Ions are captured inside the analyzer because of an applied electrostatic field. The ions in the orbitrap analyzer oscillate around the central electrode along the axis of the electrostatic field at a set frequency, ω. This frequency is used to determine the mass-to-charge ratio using the following formula:
, where k is a constant.
The following diagram is a conceptual representation of the orbitrap analyzer.
Video
For more information on orbitrap analyzers, view this video.
Identifying molecules with Tandem Mass Spectrometry (MS2)
To get better results, we can use two mass analyzers sequentially to generate and analyze ions. This technique is called tandem mass spectrometry or MS/MS (MS2). Tandem mass spectrometry is especially useful for linear polymers like proteins, RNA and DNA.
With MS2, ions called precursor ions are isolated and fragmented into ion fragments or product ions. A mass spectrum is recorded for both the precursor and the product ions.
Video
For more information on MS2, view this video.
Different fragmentation techniques to fragment peptides exist:
Collision-Induced Dissociation (CID)
Pulsed Q Dissociation (PQD)
Electron transfer dissociation (ETD)
Electron capture dissociation (ECD)
Higher energy collision dissociation (HCD)
CID is the most frequently used fragmentation technique and will therefore be discussed in more detail in the following section.
Collision-induced dissociation
Collision-induced dissociation is a method to fragment peptides using an inert gas such as argon or helium. Selected primary or precursor ions enter a collision cell filled with the inert gas. The application of the inert gas on the precursor ions causes the precursor ions that reach the energy threshold to fragment into smaller, product ions and or neutral losses. A mass spectrum is recorded for both the precursor ions and the product ions. The mass spectrum for the precursor ions will give you the mass for the entire peptide while the product ions will inform you about it’s amino acid composition.
Video
For more information on CID, view this video.
LC-MS
Liquid chromatography is often coupled with mass spectrometry to reduce complexity in the mass spectra. If complex samples were directly fed to a mass spectrometer, you would not be able to detect the less abundant analyte ions. The separated analytes from the liquid chromatography setup are directly injected into the ion source from the mass spectrometry setup. Multiple analytes that escape the column at the same time are separated by their mass-to-charge ratio using the mass spectrometer.
Refer to the image below for a diagrammatic representation of the LC-MS setup.
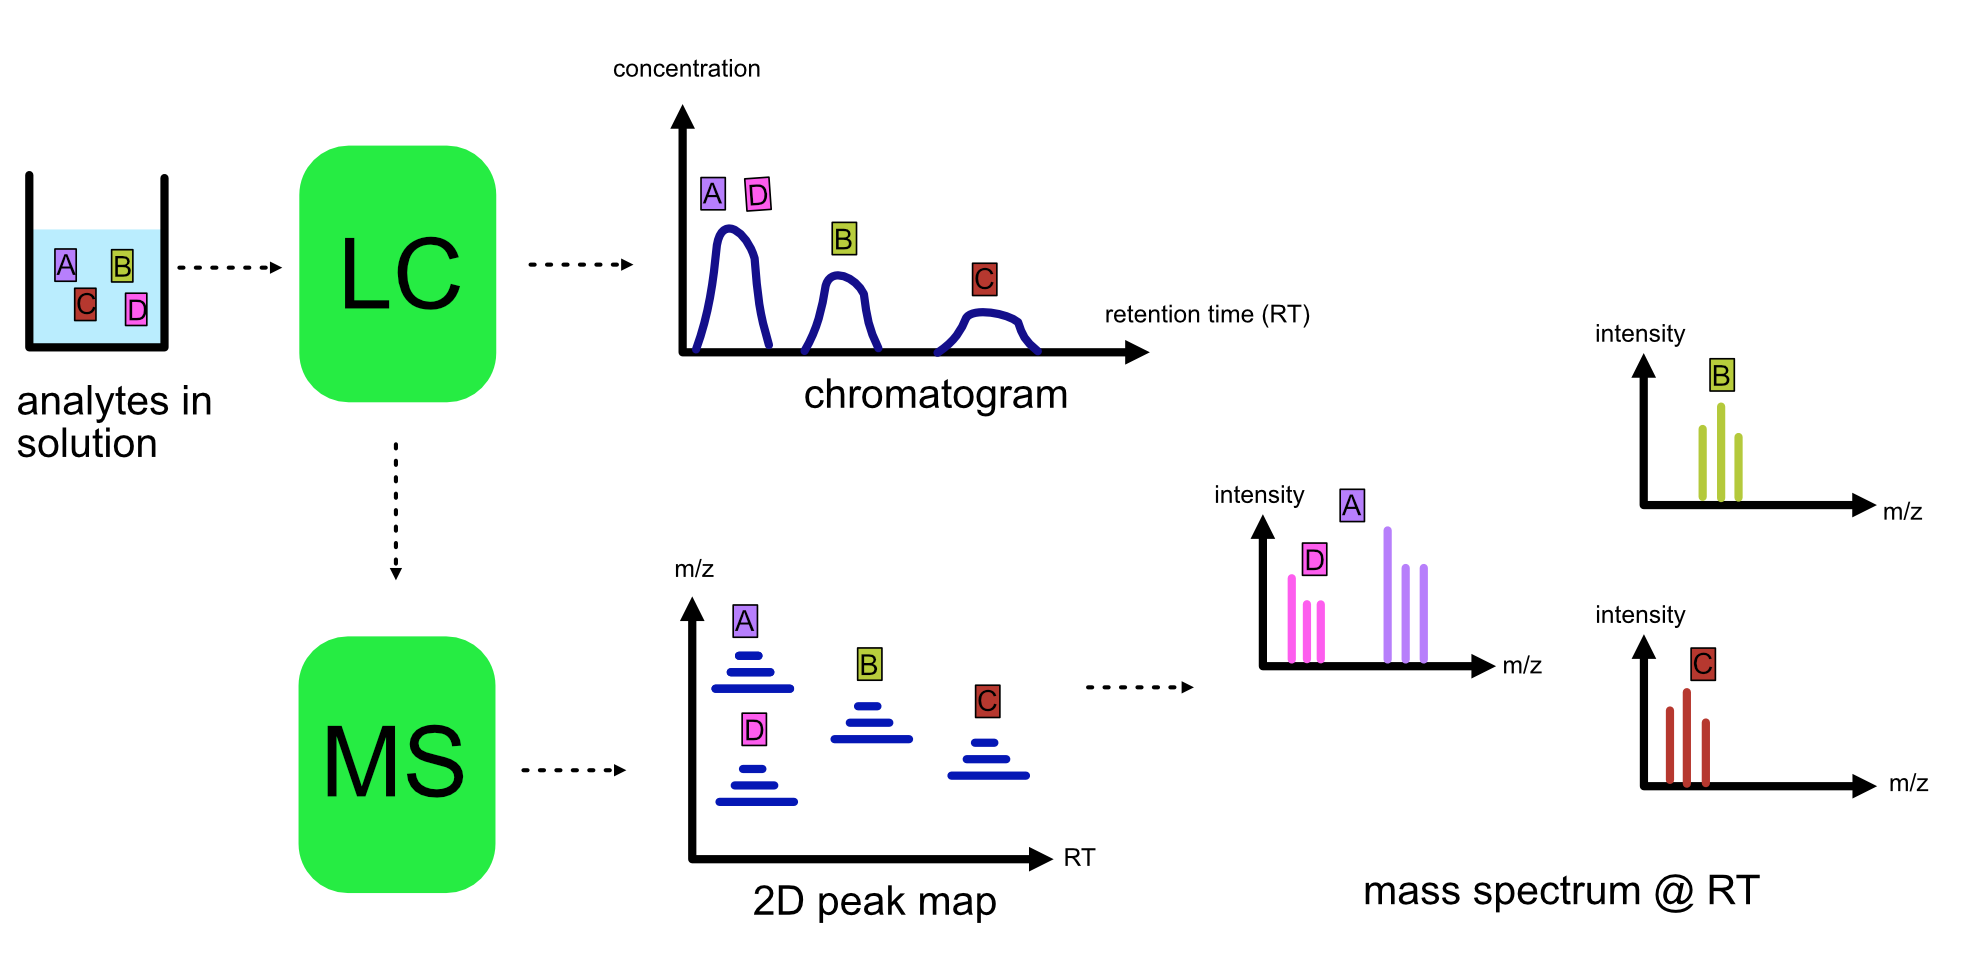
From the LC-MS setup, a set of spectra called a peak map is produced. In a peak map, each spectrum represents the ions detected at a particular retention time. Each peak in a spectrum has a retention time, mass-to-charge and intensity dimension.
From the LC-MS setup, a series of spectra are ‘stacked’ together to form what is known as a peak map. Each spectrum in a peak map is a collection of data points called peaks which indicate the retention time, mass-to-charge and intensity of each detected ion. Analyzing peak maps is difficult as different compounds can elute at the same time which means that peaks can overlap. Therefore, sophisticated techniques are required for the accurate identification and quantification of molecules.
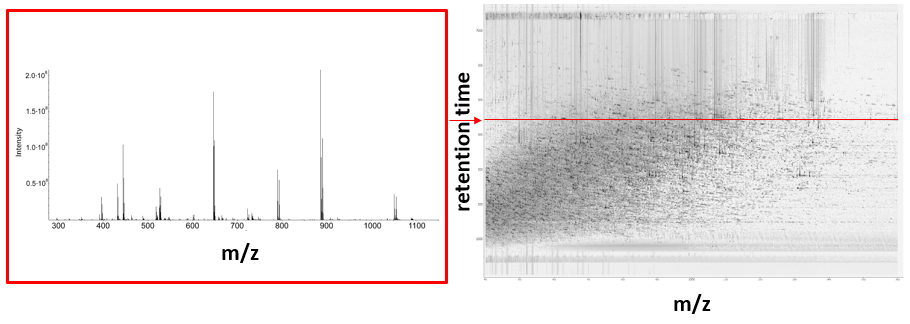
The image below includes a spectrum at a given retention time (left) and a peak map (right).
Video
For more information on a specific application of LC-MS, view this video.