Quality Control
To check the quality of the data (supports label-free workflows and IsobaricAnalyzer output):
The QualityControl TOPP tool computes and collects data which allows to compute QC metrics to check the quality of LC-MS data. Depending on the given input data, this tool collects data for metrics (see section Metrics. New metavalues will be added to existing data and the information will be written out in mzTab format. This mzTab file can then be processed using custom scripts or via the R package (see PTXQC).
Workflow
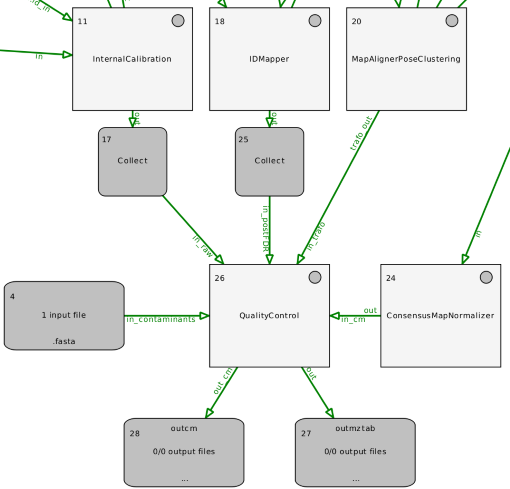
Find an example workflow in OpenMS/share/OpenMS/examples/TOPPAS/QualityControl.toppas.
For data from IsobaricAnalyzer, just provide the consensusXML as input to QualityControl. No FeatureXMLs or TrafoXMLs are required. The mzML raw file can be added as input though.
Metrics
Further headings shows what each of the included metrics does, what they need to be executed and what they add to the data or what they return.
Input Data
PostFDR FeatureXML: A FeatureXML after FDR filtering.
Contaminants Fasta file: A Fasta file containing contaminant proteins.
Raw mzML file: An unchanged mzML file.
InternalCalibration MzML file: An MzML file after internal calibration.
TrafoXML file: The RT alignment function as obtained from a MapAligner.
Contaminants
The Contaminants metric takes the contaminants database and digests the protein sequences with the digestion enzyme that is given in the featureXML. Afterwards it checks whether each of all peptide sequences of the featureXML (including the unassigned PeptideIdentifications) is registered in the contaminants database.
Required input data
Contaminants Fasta file, PostFDR FeatureXML
Output
Changes in files:
Metavalue:
is_contaminantset to1or to0if the peptide is found in the contaminant database or not and sets a0if not.
Other outputs:
Returns:
Contaminant ratio of all peptides.
Contaminant ratio of all assigned peptides.
Contaminant ratio of all unassigned peptides.
Intensity ratio of all contaminants in the assigned peptides.
Number of empty features, Number of all found features.
FragmentMassError
The FragmentMassError metric computes a list of fragment mass errors for each annotated MS2 spectrum in ppm and Da. Afterwards it calculates the mass delta between observed and theoretical peaks.
Required input data
PostFDR FeatureXML, raw mzML file
Output
Changes in files:
Metavalue:
fragment_mass_error_ppmset to the fragment mass error in parts per million.fragment_mass_error_daset to the fragment mass error in Dalton
Other Output:
Returns:
Average and variance of fragment mass errors in ppm
MissedCleavages
The MissedCleavages metric counts the number of MissedCleavages per PeptideIdentification given a FeatureMap and returns an agglomeration statistic (observed counts). Additionally the first PeptideHit of each PeptideIdentification in the FeatureMap is augmented with metavalues.
Required input data
PostFDR FeatureXML
Output
Changes in files:
Metavalue:
missed_cleavages
Other Output:
Returns:
Frequency map of missed cleavages as key/value pairs.
MS2IdentificationRate
The MS2IdentificationRate metric calculates the Rate of the MS2 identification as follows: The number of all PeptideIdentifications are counted and that number is divided by the total number of MS2 spectra.
Required input data
PostFDR FeatureXML, raw mzML file.
Output
Changes in files: This metric does not change anything in the data.
Other Output:
Returns:
Number of PeptideIdentifications
Number of MS2 spectra
Ratio of #pepID/#MS2
MzCalibration
The MzCalibration metric adds new metavalues to the first (best) hit of each PeptideIdentification. For this metric it is also possible to use this without an MzML File, but then only uncalibrated m/z error (ppm) will be reported. However, for full functionality a PeakMap/MSExperiment with original m/z-values before m/z calibration generated by InternalCalibration has to be given.
Required input data
PostFDR FeatureXML
Output
Changes in files:
Metavalues:
mz_rawset to m/z value of original experiment.mz_refset to m/z value of calculated reference.uncalibrated_mz_error_ppmset to uncalibrated m/z error in parts per million.calibrated_mz_error_ppmset to calibrated m/z error in parts per million.
Other Output: No additional output.
RTAlignment
The RTAlignment metric checks what the retention time was before the alignment and how it is after the alignment. These two values are added to the metavalues in the PeptideIdentification.
Required input data
PostFDR FeatureXML, trafoXML file
Output
Changes in files:
Metavalues:
rt_alignset to retention time after alignment.rt_rawset to retention time before alignment.
Other Output: No additional output.
TIC
The TIC metric calculates the total ion count of an MSExperiment if a bin size in RT seconds greater than 0 is given. All MS1 abundances within a bin are summed up.
Required input data
raw mzML file
Output
Changes in files: This metric does not change anything in the data.
Other Output:
Returns:
TIC chromatograms
TopNoverRT
The TopNoverRT metric calculates the ScanEventNumber (number of the MS2 scans after the MS1 scan) and adds them as the
new metavalue ScanEventNumber to the PeptideIdentifications. It finds all unidentified MS2-Spectra and adds corresponding
empty PeptideIdentifications without sequence as placeholders to the unassigned PeptideIdentification list.
Furthermore, it adds the metavalue identified to the PeptideIdentification.
Required input data
PostFDR FeatureXML, raw mzML file
Output
Changes in files:
Metavalues:
ScanEventNumberset to the calculated valueidentifiedset to+or-
If provided:
FWHMset to RT peak width for all assigned PIsion_injection_timeset to injection time from MS2 spectrumactivation_methodset to activation method from MS2 spectrumtotal_ion_countset to summed intensity from MS2 spectrumbase_peak_intensityset to highest intensity from MS2 spectrum
Additionally:
Adds empty PeptideIdentifications
Other Output: No additional output.